| Date: 10/13/2026 | N-Number: N830EH | Airport: 7WI5 | Altimeter: 29.85 |
| Test Conductor: Evan Krueger | Observer: | ||
| Start Time: 1:46 | Off Time: 11:54 | On Time: 13:07 | End Time: 13:10 |
| Block Time: 1.4 | Flight Time: 1.3 | ||
| T/O Weight: 1,044 | T/O CG: 66.0 | Takeoff Trim: 3.5 Turns | Takeoff Flaps: 0° |
| Start Fuel: 13 | End Fuel: 4 | CHT Limit: 392°F | Oil Temp Limit: 244°F |
CG: In the recommended envelope
Fuel: One hour minimum
Precompute: Desired test speeds for test card
Procedures:
- START: Normal
- Record engine instrument readings when stabilized, before takeoff.
- Normal takeoff and climb
- LEVEL OFF: Straight-and-level flight at 3,000 agl
- Set altimeter to 29.92 and record pressure altitude
- Configure and trim airplane according to test card
- Record outside air temperature.
- Fly first heading absolutely straight and level with minimum control inputs and no power changes.
- When parameters have stabilized for at least 15 seconds, record GPS groundspeed and IAS.
- Turn to successive headings; stabilize on same IAS with no altitude changes and record data.
- Repeat test as needed.
- Record engine data after high-speed run
- LANDING: Normal
- SHUTDOWN: Normal
Results:
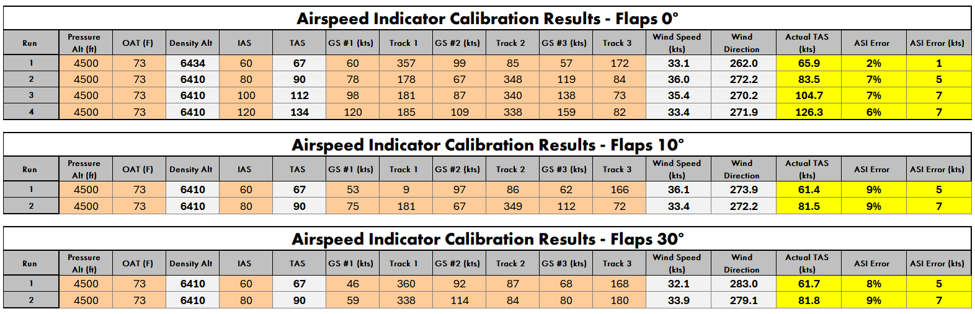
Performed test card as described in the test manual at 4,500 feet msl on the least windy day that could be found given the time of year. Climbed up to starting altitude and configured aircraft as needed for each triangle course. Opted to test flaps up speeds at 60, 80, 100, and 120 knots and flaps down speeds at 60 and 80 knots. Flew each speed and configuration on a heading of 80, 200, and 320 degrees (for a total of 8 “triangle courses”) and allowed parameters to stabilize before recording GPS track and groundspeed. Temps stabilized more than previous tests during all phases of flight. Returned to the airport for a normal landing and entered data into spreadsheet to determine ASI error. Compared calculated winds aloft data with winds aloft forecast; both were close and the calculated wind speed and direction was fairly consistent across runs. Data analysis shows that pitot-static installation error varies between 2% and 9% (1 to 7 knots) at the tested speeds and configurations. In general, the system is less accurate at higher speeds and with flaps deployed. While the flaps down data approaches the limit of reasonable error, I feel comfortable with this information backed up by the angle of attack indicator that will be calibrated in future flight testing. Below is the raw test data along with the airspeed calibration table that will be published in the aircraft operating handbook.
| KIAS | Calibrated Airspeed (KCAS) | ||
| Flaps Up | Flaps 10° | Flaps 30° | |
| 60 | 59 | 55 | 55 |
| 80 | 75 | 73 | 73 |
| 100 | 93 | ||
| 120 | 113 | ||
Leave a Reply